Volcano watching

For those of us with friends and families stranded away from home because of “that volcano” in Iceland, and those who had been planning to travel through Europe in the next few days, volcano watching has become a way of life. There is a myriad of resources providing information on volcanoes in general, the progress of ash clouds, and links to live volcano web cams including Eyjafjallajökull – the current villain of the piece.

Let’s start with the web cams. Volcano Web Cams – John Seach http://www.volcanolive.com/volcanocams.html has links to some of them including Eyjafjallajökull (http://eldgos.mila.is/eyjafjallajokull-fra-valahnjuk/). At the time of writing, though, the servers linking the three web cams covering Iceland’s bête noire to the rest of the world appear to have been overloaded with traffic and are rejecting connections. A list of US volcano web cams is on the US Geological Survey web site at Volcano Hazards Program Webcams http://volcanoes.usgs.gov/images/webcams.php. For volcanoes elsewhere, Volcano WebCams around the Pacific Ring of Fire and Beyond is at http://www.skimountaineer.com/ROF/VolcanoWebCams.php.

General information and data on US volcanoes is available via the USGS at http://volcanoes.usgs.gov/vhp/observatories.php. If you are worried about supervolcano Jellystone – sorry, Yellowstone – going up, that has its own observatory at http://volcanoes.usgs.gov/yvo. For volcanoes worldwide there is a comprehensive list at the Smithsonian Institution Global Volcanism Program (http://www.volcano.si.edu/) that you can download in Excel format. The list is is also available on the Guardian datablog at “Volcanic ash: how do you spot the next volcano to disrupt flights?” http://www.guardian.co.uk/news/datablog/2010/apr/20/volcanic-ash-smithsonian-icao. In addition The Guardian article includes the ICAO map (International Civil Aviation Organization) that shows how flight routes cross volcanic risks.

The London Volcanic Ash Advisory Centre at the UK Met Office issues updated graphics of the ash cloud at http://www.metoffice.gov.uk/aviation/vaac/vaacuk_vag.html.
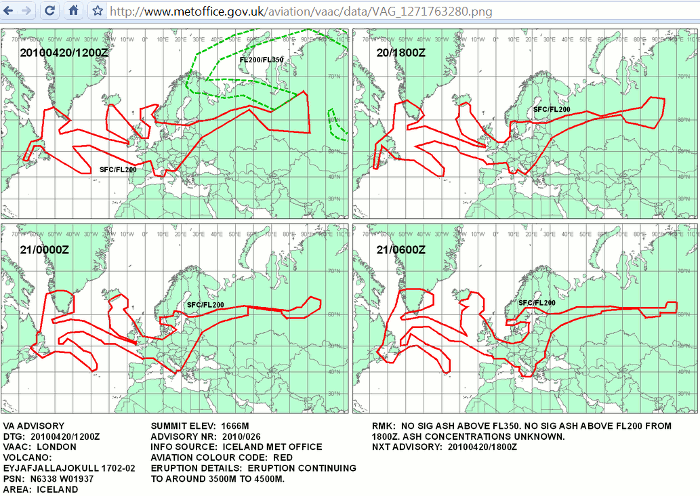
London VAAC Images

The Guardian news blog has updated daily blog postings of all news concerning the volcano and its impact on travel. Today’s posting is at http://www.guardian.co.uk/world/blog/2010/apr/20/iceland-volcano-ash-flights-eruption.

And finally, there are some spectacular and beautiful photographs at “More from Eyjafjallajokull” http://www.boston.com/bigpicture/2010/04/more_from_eyjafjallajokull.html
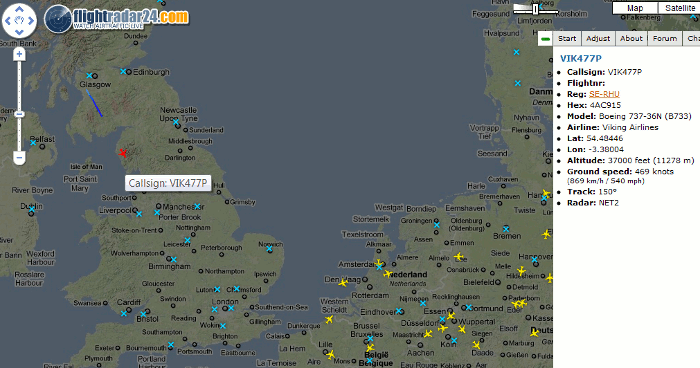
Flightradar24 – watch air traffic live

Flightradar24.com shows live aircraft traffic in the airspace above Europe, of which there has been very little over the past few days. It is a mashup of Google Maps, airport locations, broadcast air traffic data and photos of some of the aircraft.

It uses data a flight information system called ADS-B (Automatic Dependent Surveillance-Broadcast) and this data is provided by a network of 100 volunteers equipped with ADS-B receivers, most of whom are in Europe. Not all aircraft are picked up; only about 60% of passenger planes and only a few military and private planes have an ADS-B transponder. A list of aircraft models that are visible and those that are not can be found at http://www.flightradar24.com/about.php.

Major airports are marked on the map with a blue cross and the position of airplanes with – erm – airplane icons.

Flightradar24 Map
Image courtesy of Flightradar24


Flightradar24 plane and flight information
Image courtesy of Flightradar24

Click on a plane and the path that it has taken is displayed. The colour of the trail behind the plane shows the altitude the aircraft had at that position. (An explanation of the trail colours is at http://www.flightradar24.com/about.php).

Additional information on the flight appears on the right of the screen and includes – when available – flight number, airline, the type of plane, altitude, speed, where the flight took off and destination. For many of the Scandinavian airlines’ planes there are also photos and  for some planes you can view their recent flight history.

On a technical note this site relies heavily on the use of  javascript so to get the best out of this site users are advised to use Firefox or Google Chrome.

Other issues to bear in mind are that even for Europe coverage is not 100% and, most important of all, it is seriously addictive!

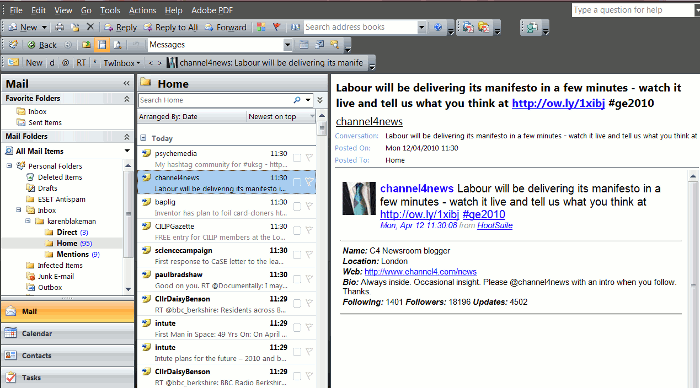
TwInbox – Use Twitter from Outlook

http://www.techhit.com/TwInbox/twitter_plugin_outlook.html

This free plug in enables you to view and manage your Twitterstream from within Outlook.

Technical requirements are Microsoft Windows 2000, XP, Windows Vista or Windows 7 with the latest Service Pack. Outlook 2003 SP3, 2007 SP2, 2010 (32-bit and 64-bit.). Note that TwInbox does NOT work with Outlook Express.

According to the web page, features include:

  • Update your Twitter status directly from Outlook.
  • Receive your Twitterstream updates in Outlook.
  • Archive, manage, group and search your tweets in the same way you manage your email
  • Search and track keywords
  • Group tweets by sender, topic, etc using the Search feature
  • Manage multiple Twitter accounts
  • Assign custom folder and categories to new messages
  • Use Outlook’s “Reply” and “ReplyAll” commands to send twitter direct messages and @replies
  • Automatically sort new tweets into folders
  • Shorten URLs with bit.ly
  • See graphs of your Twitter usage statistics

I am still experimenting so can’t yet comment on how easy the above are to set up. I shall probably continue to use Tweetdeck as my main application for managing my Twitter accounts on a day to day basis. TwInbox, though, seems to be a quick and easy way of archiving tweets that contain information I may want to refer to at a later date.

Internet Statistics: BBC SuperPower – Visualising the internet

Looking for some interesting stats about the web? Then head straight for this section on the BBC web site (http://news.bbc.co.uk/1/hi/technology/8552415.stm), which is part of SuperPower, a season of programmes exploring the power of the internet. It provides a range of statistics including interactive graphics showing the most visited sites and types of site on the internet (as measured by Nielsen). The top 100 sites graphic breaks down into search/portals, social networks, retail sites, media/news and by country. Move your cursor over a block in the visualistaion and it will display the name of the site, number of unique visitors and percentage market share.

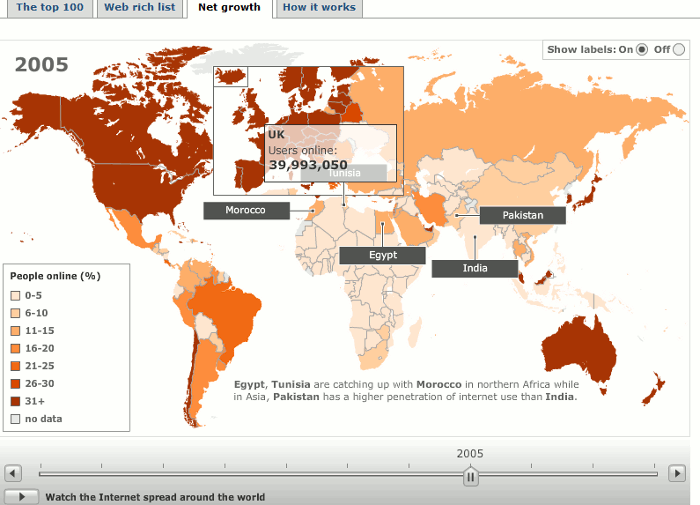
The Web Rich List holds no surprises with Larry Page and Sergey Brin at the top and both worth 17.5 billion USD. The Net Growth map has a slider bar underneath it that you can use to view internet usage over time. Set the slider bar at the year you are interested in, move your cursor over a country and it will tell you the number of users.

Growth of the Internet

‘How it Works’ has a very basic set of slides about how the Internet works but you might find the counters to the right of the slides more interesting. They claim to show the estimated number of internet users in the world, the number of email messages posted so far today (includes spam), the number of blog posts today, and the approximate number of Google searches today. An obvious number that is missing is the number of Tweets but you can find some statistics on Twitter’s own blog at Twitter Blog: Measuring Tweets http://blog.twitter.com/2010/02/measuring-tweets.html

Earthquake Alerts

If you are looking for up to the minute news on earthquakes it would seem that Twitter beats the mainstream news media even when major shocks have occurred. Phil Bradley has carried out a comparison of the timeliness and quality of information about the Baja 7.2 earthquake provided by Sky News, CNN, ABC, Google News, BBC and Twitter (Phil Bradley’s weblog: Earthquake: Twitter trounces traditional news sources again! http://philbradley.typepad.com/phil_bradleys_weblog/2010/04/earthquake-twitter-trounces-traditional-news-sources-again.html). Not surprisingly Twitter came out on top in terms of speed of reporting but what is amazing is that some people actually tweet while the earthquake is happening. Fine if you are in open countryside but if I was in a built up area I’d be more worried about falling buildings: but then if you are strolling through fields and mountains there is always the possibility that the ground will open up and swallow you. Now that would be worth tweeting about!

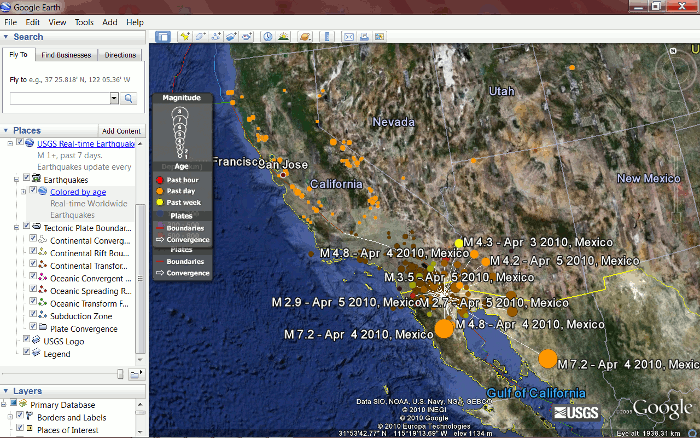
If you want up to the minute scientific data on earthquakes, the USGS (US Geological Survey) has a page with a map showing recent tremors and links to RSS feeds giving you date, time, location and magnitude (Earthquakes
http://earthquake.usgs.gov/earthquakes/). They also provide the data as CSV files, an iGoogle gadget and KML feeds for Google Earth.

Google Earth and USGS KML feeds

Google Earth and USGS KML feeds

I have friends and colleagues who live in earthquake zones in New Zealand, China and Turkey. The first major shock is always reported by the press – eventually – as are some of the major aftershocks, but the best way for me to find out what is happening to them is a combination of Twitter and the USGS data. Follow the latter and you will quickly discover that earthquakes are happening somewhere on this planet all of time, most of them of low magnitude. You will also notice that after a major earthquake there are not dozens but hundreds of aftershocks, as I learned from my New Zealand friends. The traditional press have moved on to more interesting stories but the people in the affected region are having to deal with the consequences of not only the first major quake but also the continual aftershocks.

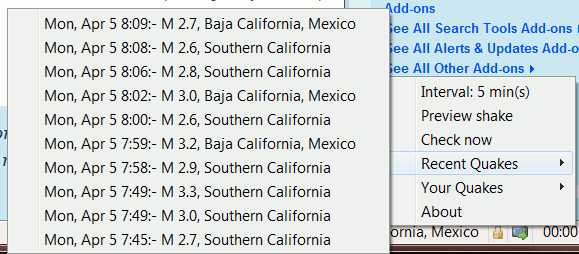
The RSS feeds are good way of keeping up with quake events but I only dip into my feed reader 3 or 4 times a day. Most of my online life is spent in my browser Firefox. Enter the eQuake Alert add-on for Firefox.(https://addons.mozilla.org/en-US/firefox/addon/2239/) This uses USGS data and adds an alert to the status bar of Firefox showing you the magnitude and location of the latest event. Right click on the alert and you can choose to view a list of recent of quakes that also gives you date and time.

eQuake Alert

As an additional alert there is an option to “Shake browser on earthquake”. This makes your browser screen wobble when news of a quake comes through and you can set it to shake proportional to earthquake magnitude. No chance of missing it now! You can also set a minimum magnitude for alerts, which is useful if you the perpetual wobbling of the screen becomes too intrusive. Mine was originally set to 3 but for hours after the Baja earthquake aftershocks seemed to be occurring every other minute so I increased it to 4

When combined, the different services provide me with a clearer picture of what is going on and help me find out if friends and colleagues have been seriously affected. The Firefox eQuake add-on alerts me to events within a few minutes of their occurrence. The USGS RSS feeds show me what has been happening over the past 24 hours. Twitter provides immediate reports from people in the earthquake zone. Eventually the traditional news media will report and my Google News alerts will kick in. And finally, the USGS KML feeds for Google Earth provide an incredible visualisation of the extent and impact of a series of quakes in a region.

UK National Archives on Flickr

The UK’s National Archives have added over 200 of their photos to their Flickr photostream. They can be found at http://www.flickr.com/photos/nationalarchives/. It is an interesting mix including Maps and Plans, Historical Documents, 19th and 20th century photographs, and 23 photographs taken by Felice Beato on the expedition for the relief of Khartoum in Sudan. There have already been comments about spelling mistakes and inconsistencies  in some of the photograph descriptions but National Archives have explained that they have reproduced exactly the photographers’ own notes if available. The tags added to the photos by National archives do have the modern spellings.

National Archives on Flickr

The photos have “no known copyright restrictions”:

“The National Archives is unaware of any current copyright restrictions on these images either because they are Crown Copyright and the copyright is waived or the term of copyright has expired. All of the images may be subject to other third party rights, such as rights of privacy. You are responsible for obtaining other such necessary permissions for reuse”

The images may be downloaded and reused without permission in any format for purposes of research, private study or education (non-commercial use) only. You are also asked to credit ‘The National Archives’ and include the catalogue reference of the item to allow others to access the original image or document.