Statista (http://www.statista.com/) is a portal for statistics, market data, market research and survey results. It aggregates data on over 600 international industries from more than 18,000 sources, including market researchers, trade organizations, scientific journals, and government databases. You can get a rough idea of what the service covers from the list of topics at http://www.statista.com/topics/, although this does give the impression that it is heavily US biased, which is not the case.
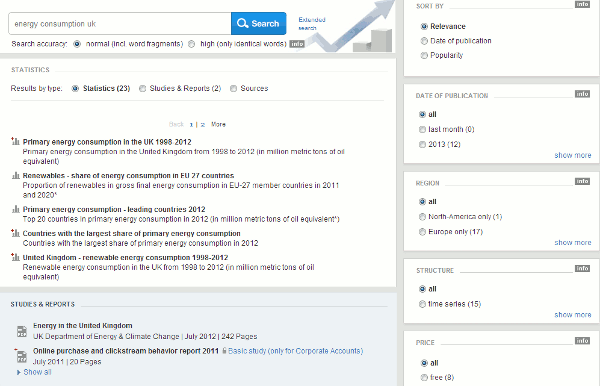
Searching Statista is straightforward. The default is to include what it calls word fragments, so a search on the term bank will also find banking. This can be changed to identical words if you require an exact match. To search for phrases place double quote marks around your terms, and documents containing a specific term can be excluded by prefixing the word with an exclamation mark. You can ‘OR’ terms by inserting the vertical bar symbol (|) between them, for example dog | cat. To refine your search further use the options on the right hand side of the results page. These include date of publication, region, free/fee-based/all, and category.
Trying to view the data and charts that you find can be a frustrating process as most of the information is only available on subscription. There is a limited amount of free information but you still have to register for what Statista calls its basic free access. The premium account for an individual user is USD 49/month and runs for a minimum of 12 months. This is automatically renewed so make sure you cancel before the year is up if you no longer wish to use it. The corporate subscription is USD 199.90/month. Again the subscription runs for 12 months. A free trial is available for the corporate service but not for individual users. Prices for universities, libraries and education are available on request.
On the results page you can easily identify the subscription content by the red plus sign next to the chart icon to the left of the result. A red ‘P’ indicates a priced report that is free to corporate clients but can be purchased by basic and premium account holders.
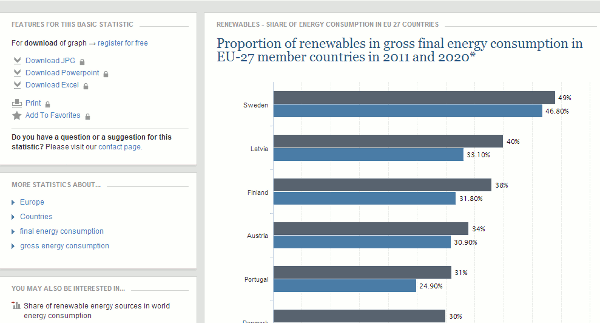
Clicking on a result takes you to a page where the data is displayed as a chart or graph depending on what Statista thinks is the most appropriate for that statistic, but you can change the representation if you wish. There are also options for downloading the data in various formats and links to the original source.
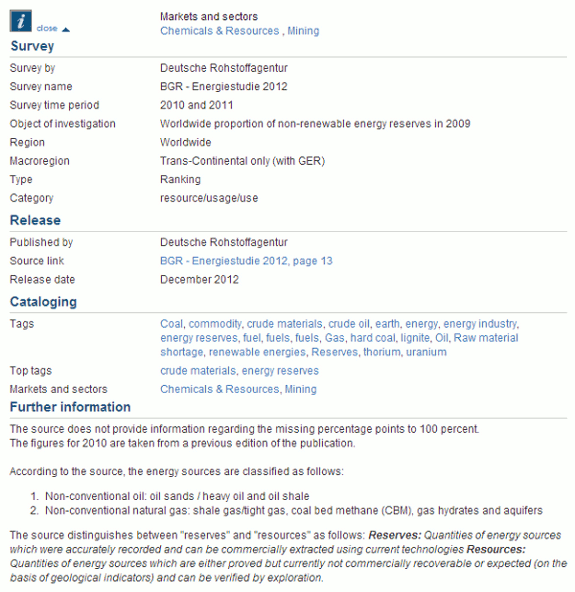
Information is provided on the source and includes title of the original document, the publisher, publication date, time period covered by the survey and the geographical regions covered. Statista also adds notes such as definitions of terms used in the original report and observations on possible missing data.
Much of the information on Statista can be found by via Google or Bing using advanced search commands and options, but you will probably have to wade through a significant amount of irrelevant information before you find the data you need. Statista can certainly save you a considerable amount of time, and the data displays are a great way of helping you identify the potential usefulness of a report, as can the metadata and notes.
Is the subscription worth it? It is definitely cost effective for corporates in terms of saving search time and ensuring accuracy and quality of information. I have had good feedback about Statista from several of my clients. I am not so sure about individual users. Some of my own research is highly specialised and I am not convinced that Statista covers all of the areas of interest to me. It is difficult for me to assess its value without trialing the full service first, and there are no pay as you go options such as a day or weekly rate. I might even consider paying for a month’s access for a project but it is a full year’s subscription or nothing. Nevertheless, I recommend you take a serious look at it and if you are contemplating a corporate subscription you can ask for a free trial. It is now on my list of essential research tools.


