Tag Archives: mashups

Pancakes and Mash: mashed library unconference – places still available

Pancakes and Mash
Pancakes and Mash http://www.flickr.com/photos/pstainthorp/5388040023/

There are 14 places remaining on Mashed Library “Pancakes and Mash”, a library technology un-conference taking place at the University of Lincoln on 8 March 2011 (Shrove Tuesday).

You can claim one of the last 14 places at: http://mashlib.blogs.lincoln.ac.uk/booking/

Booking costs only £12 and will remain open until Monday, 28 February.

There’s a growing list of delegates, drawn from a range of academic, public and commercial libraries at http://mashlib.blogs.lincoln.ac.uk/who/

The programme is taking shape and the organisers are confirming speakers/mashup ‘experts’ for the various workshop sessions. The keynote presentation will be from Gary Green (Technical Librarian, Surrey County Council Library Service) on: “Loud Library Voices: Campaigning, The Web, Journalists & The Offline World”.

Further details and programme (in perpetual beta) at http://mashlib.blogs.lincoln.ac.uk/

For photos of previous events search Flickr.com for mashlib, haggisandmash, mashliv, mashspa, chipsandmash or middlemash just for starters!

UK crime data as clear as mud

I’m a nosy neighbour. I like to know what’s going on in my area: who’s bought the house next door, local planning applications, any dodgy activity going on? My husband and I are both self employed so there is usually at least one of us out and about in Caversham during the day. That means we have the chance to chat with our local postman, workmen digging up the road, Police Community Support Officers doing their rounds and with people in the local shops, bank and post office. Crime, not surprisingly, is a major topic on our “watch list” and just over two years ago police forces in England and Wales started to provide access to local crime statistics via online maps. The new service allowed you to drill down to ward level and view trends in burglary, robbery, theft, vehicle crime, violent crime and anti-social behaviour.

The format varied from one police force to another. For example Thames Valley Police provided a basic map and tables of data:
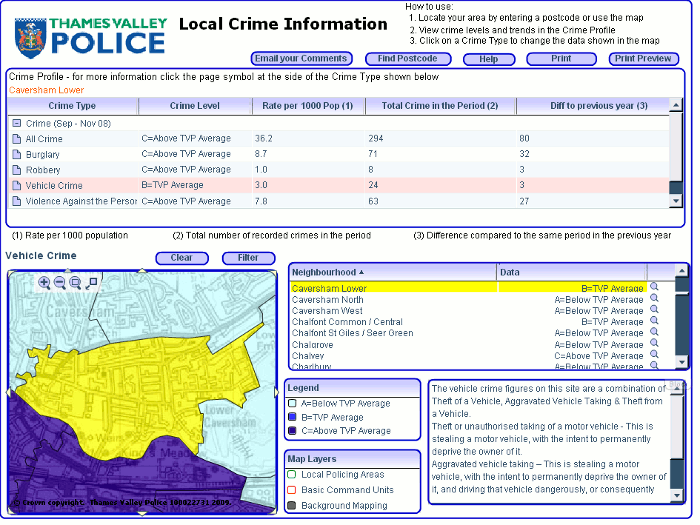
Thames Valley Police 2008 crime rates

Others such as the Metropolitan Police included additional graphical representation of the statistics such as  bar charts:
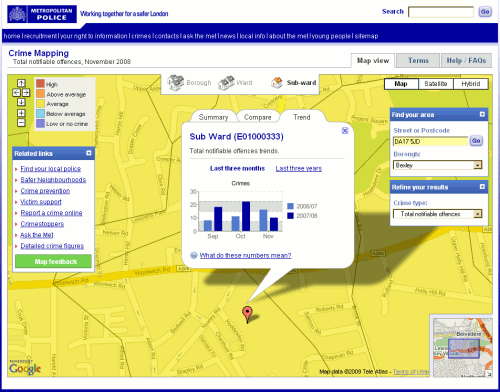
Metropolitan Police 2008 Crime Rates

None of them pinned down incidents to individual streets or addresses but they did give you an idea of the level of crime in a particular neighbourhood, how it compared with the same period the previous year and whether it was high, above average, average, below average, low or no crime. They were short, though, on detailed definitions of what each category of crime included. I looked at these maps out of personal curiosity rather than using them for any serious business application, and I made certain assumptions such as murder being included under ‘Violence against the person’. That may not have been the case.

Some police forces placed obvious links to the information on their home pages whilst others buried the data in obscure corners of their web sites. The crime maps where then all moved to the CrimeMapper web site – the Thames Valley Police map can still be seen at http://maps.police.uk/view/thames-valley – but that has now been integrated into Police.uk website, which “includes street-level crime data and many other enhancements“.

All you have to do is go to http://www.police.uk/, type in your postcode, town, village or street into the search box and “get instant access to street-level crime maps and data, as well as details of your local policing team and beat meetings“. The first screen looks good with news of local meetings, events, recent tweets, YouTube videos and – as the home page promised – information on my local policing team.
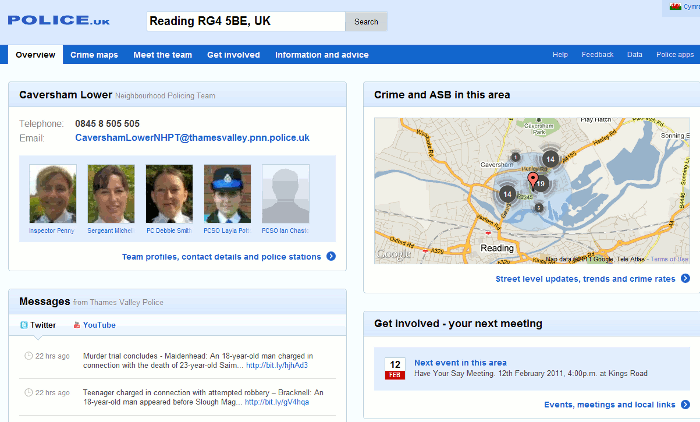
Police UK page for RG4 5BE

When I focus on the map to look at the detail there are markers for the location of the crimes and clicking on them gives you a brief description of the crime:
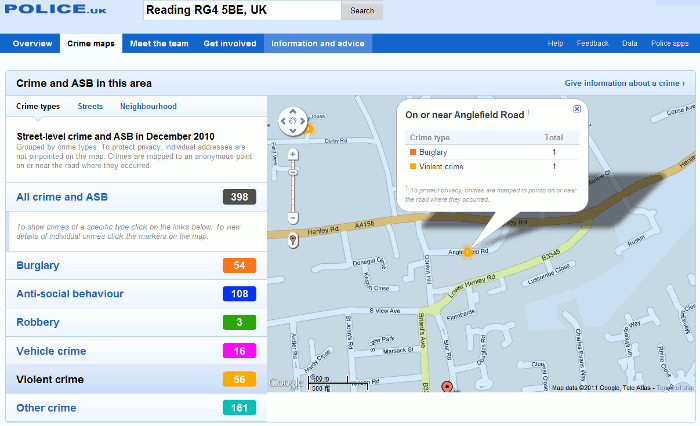
Detail on Police UK crime rates for Caversham

In this example, the detail box had details of two crimes “on or near Anglefield Road” and this is where I started to become confused. Were the burglary and the violent crime part  of the same incident or totally separate? Furthermore, if you look in the left hand panel of the screen you will see “To protect privacy, individual addresses are not pinpointed on the map. Crimes are mapped to an anonymous point on or near the road where they occurred.” Fair enough, but I would like to know how near ‘near’ is. 100, 200, 400 yards? Half a mile, a mile? And does the focus shift from one street to another from one month to the next? If it stays put then a street could gain a crime rate reputation that it does not deserve but if it shifts there is no way one can compare data from one month or year to another, which brings me to my next question.

Why is there only one month’s data? Previous versions of the crime maps gave you three months data for the current and the previous year for comparison. There is nothing about this in the Help section of  the Police UK site but the Guardian reports:

police forces have indicated that whenever a new set of data is uploaded – probably each month – the previous set will be removed from public view, making comparisons impossible unless outside developers actively store it.” (Crime maps are ‘worse than useless’, claim developers http://www.guardian.co.uk/technology/2011/feb/02/uk-crime-maps-developers-unhappy?CMP=twt_iph).

This means that if you want to run comparisons over time you will have to download the files and store them on your own system each month, or find someone else who is already doing it.

The Guardian article also says:

the Information Commissioner‘s Office (ICO) advised that tying crime reports to postcodes or streets with fewer than 12 addresses would render the individuals involved too identifiable. The police have also decided to remove data about murders or sexual assaults.

With respect to the latter the help file on the Police UK site suggests otherwise:

Crimes have been grouped into six categories following advice from the Information Commissioner’s Office. This doesn’t mean that the crimes listed under ‘other’ are not seen as important. Rather it ensures that for some of the more sensitive crimes there is even greater privacy for the victims.

So which is it: murders and sexual assaults are not included at all or aggregated under “other”? Jonathan Raper says on his blog Placr News (“Five reasons to be cautious about street level crime data” http://placr.co.uk/blog/2011/02/five-reasons-to-be-cautious-about-street-level-crime-data/):

Some data is redacted eg sexual offences, murder. The Metropolitan Police has already released this data to ward level though… and it is easy to cross-reference one murder in one ward to reports in the local press at the same time

Data visualisations and mashups are becoming increasingly popular and make it considerably easier to assess a situation and view trends. The Guardian Datablog (http://www.guardian.co.uk/news/datablog), for example, encourages people to take data sets, mash them up and create their own visualisations, and upload a screen shot to  the Guardian Datastore on Flickr (http://www.flickr.com/groups/1115946@N24/). It is vital, though, that the source of the data, whether the full data set or just a selection has been used, and whether or not it is going to be updated is clearly spelt out. All too often one or even all of these are missing from the accompanying notes, and in some cases there are no notes at all!

An example of good practice is “UK transport mapped: Every bus stop, train station, ferry port and taxi rank in Britain” (http://www.guardian.co.uk/news/datablog/2010/sep/27/uk-transport-national-public-data-repository). The posting clearly states the source (http://data.gov.uk/dataset/nptdr) and its coverage:

“A snapshot of every public transport journey in Great Britain for a selected week in October each year. The dataset is compiled with information from many sources, including local public transport information from each of the traveline regions, also coach services from the national coach services database and rail information from the Association of Train Operating Companies”

It then goes on to specify the time period  (5-11 October, 2009) and the tools that were used to create the visualisation.

Another is the “Live map of London Underground trains” (http://traintimes.org.uk/map/tube/). This shows “all trains on the London Underground network in approximately real time“. The source is a live data feed from Transport for London (TfL) and the notes state that a “small number of stations are misplaced or missing; occasional trains behave oddly; some H&C and Circle stations are missing in the TfL feed.” It would be helpful to have a list of those missing stations, but the site has at least brought the issue of potential missing data to the users’ attention.

Returning to the Police.uk crime data, there are three major problems with the site for me as a researcher:

1. Are all crimes included in the database, or are some such as murders and sexual assaults excluded altogether or aggregated under “other”? More detailed and unambiguous scope notes please.

2. The street data level is useless. The markers are not exact locations but “near” to, there is no definition of “near”, no information on how the position of the marker is calculated or the geographic radius that it covers. It would be better to return to aggregated data at the ward level.

3. There are no options for comparing time periods and it seems that historical data will not be available on the web site. An ad hoc researcher will have to spend time and effort tracking down a developer or a web site that is downloading and keeping copies of all of the datasets as they are published.

The new crime data web site is a retrograde step. We need transparency and clarity rather than the muddle and confusion that has been generated by the lack of information on what is being provided.

Tweetminster maps turnout in UK election

Tweetminster, Channel 4, The Guardian and the New Statesman are teaming up to map voter turnout in the UK general election today (6th May 2010). See http://tweetminster.tumblr.com/post/568070812/help-us-map-voter-turnout-on-may-6th for details. Twitter users are being asked to tweet #ukvote followed by the first half of their postcode and the information will be plotted on a map in real time at http://tweetminster.co.uk/. Voters do not have to reveal who they voted for.

Obviously the map will be biassed as it will only include information from those on Twitter but the aim is to encourage more people to vote and to help get a sense of turnout during the course of the day and across the country. You may recognise the format as being similar to the #uksnow maps, which inspired this initiative.

If you haven’t come across Tweetminster before, this was set up in 2009 to enable people to follow MPs and UK politics on Twitter. You can track the tweets of MPs, Prospective Parliamentary Candidates (PPCs), as well as political journalists, comentators and news sources. Further details of the 2009 launch of Tweetminster can be found in The Independent and Tweetminster team up to launch Twitter-based service

Flightradar24 – watch air traffic live

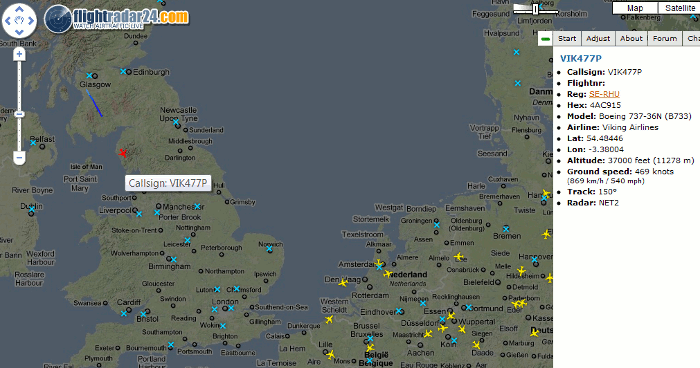
Flightradar24.com shows live aircraft traffic in the airspace above Europe, of which there has been very little over the past few days. It is a mashup of Google Maps, airport locations, broadcast air traffic data and photos of some of the aircraft.

It uses data a flight information system called ADS-B (Automatic Dependent Surveillance-Broadcast) and this data is provided by a network of 100 volunteers equipped with ADS-B receivers, most of whom are in Europe. Not all aircraft are picked up; only about 60% of passenger planes and only a few military and private planes have an ADS-B transponder. A list of aircraft models that are visible and those that are not can be found at http://www.flightradar24.com/about.php.

Major airports are marked on the map with a blue cross and the position of airplanes with – erm – airplane icons.

Flightradar24 Map
Image courtesy of Flightradar24


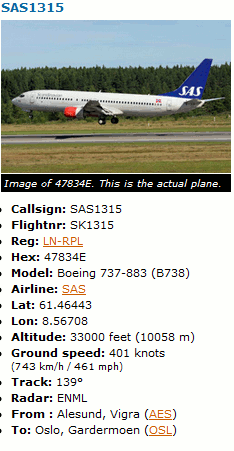
Flightradar24 plane and flight information
Image courtesy of Flightradar24

Click on a plane and the path that it has taken is displayed. The colour of the trail behind the plane shows the altitude the aircraft had at that position. (An explanation of the trail colours is at http://www.flightradar24.com/about.php).

Additional information on the flight appears on the right of the screen and includes – when available – flight number, airline, the type of plane, altitude, speed, where the flight took off and destination. For many of the Scandinavian airlines’ planes there are also photos and  for some planes you can view their recent flight history.

On a technical note this site relies heavily on the use of  javascript so to get the best out of this site users are advised to use Firefox or Google Chrome.

Other issues to bear in mind are that even for Europe coverage is not 100% and, most important of all, it is seriously addictive!

Potholes.co.uk

The snow has started to clear in Caversham and the lower half of the road on Donkin Hill looks as though it has been repeatedly bombed. Major cracks, huge potholes and an alarming amount of subsidence are now in evidence. It is a scene that is going to be repeated over the whole of the UK in the next few days as the snow and ice retreat to reveal the damage caused by the freezing weather. I shall be out with my camera and reporting the state of the road to the council via FixMyStreet (see my earlier posting on this excellent service). I am sure our local Council will be inundated with similar reports from around Reading.

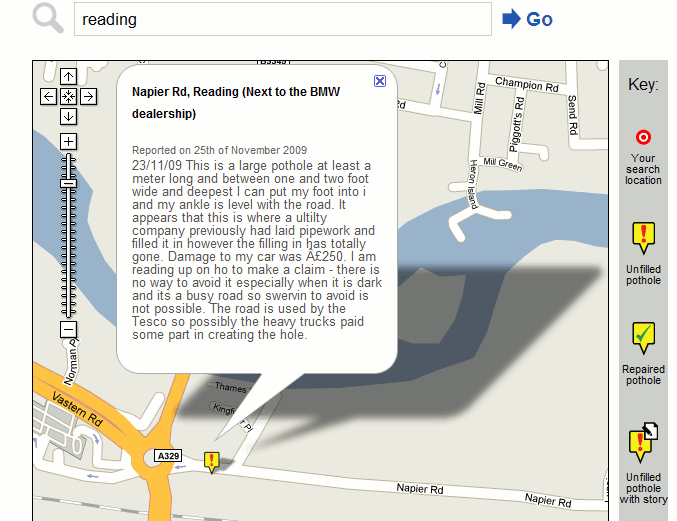
Potholes.co.uk is run by Warranty Direct who specialise in used car warranty, new car warranty and extended warranty. It is a “Campaign website to highlight poor state of British roads and help motorists seek compensation from Councils”. Type in the first part of a postcode or the name of a town to view a Google map showing the location of any potholes in the area. Click on a marker to see a more detailed description of the problem.

Potholes UK

To report a pothole you need to register and sign in. First enter a title and description and then the street name and town. A Google map should appear with a marker and you can then drag the marker to the exact location of the pothole(s). You can also upload a photo. Once you have submitted your report you are taken to a page where you are encouraged to report the problem to the local council.

There is a blog at http://www.potholes.co.uk/oursays where they talk about pothole issues and highlight news stories. Potholes.co.uk is also on Twitter at http://twitter.com/potholesuk/

I am not sure how useful this site really is for motorists as it is dependent on people reporting potholes to the web site, so it is not comprehensive. It is also not clear who marks the potholes as filled when the repairs are made. Feedback on both of those points would be welcomed.

Thanks to @cllrdaisybenson for the tweet that alerted me to the site.

Fix My Street

FixMyStreet is another service from those excellent people at Mysociety.org. So you’ve got a problem in your neighbourhood that you thought your local council would have dealt with by now. Road drains not clearing? Broken man-hole cover? Industrial waste dumped in your street? Your council may not know about it so this is your opportunity to tell them or chase up an ongoing problem.

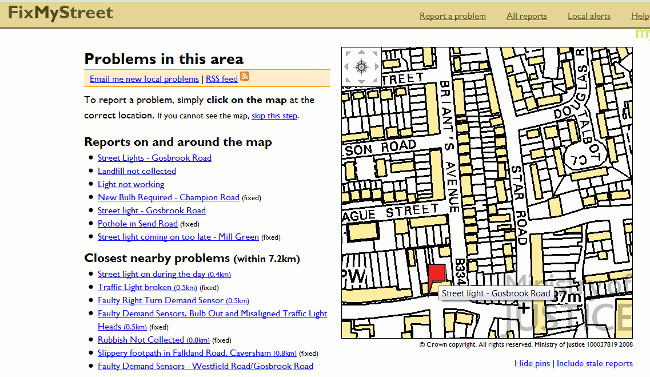
All you have to do is enter the postcode, street name or area. You should then see a map showing existing and previous problems.

FixMystreet

To report a new problem, click on the location of the problem on the map. A purple flag will appear and then you fill in the boxes: category (drop down menu), details of the problem, upload a photo if available, and email address and telephone number. Then Submit. FixMyStreet will send your report to the council on your behalf. “Simples”!

You can also subscribe to problem alerts. These can be delivered by RSS feeds or emails alerting you to problems within 7.3 km of your post code (the default), or 2, 5,10 or 20 km. Alternatively you can choose to receive all alerts in the area covered by your council or ward.

Information on other MySociety.org projects such as they “They Work For You” (details of your MP and their activities and “What do they Know ” (Freedom of Information) are available at http://www.mysociety.org/projects/

BBOD mashups presentation

My presentation on mashups, which I am giving at the BBOD evening meeting today (5th May 2009), is now available on Slideshare, authorSTREAM and Slideboom. Choose your favourite presentation site and download.

It consists mostly of screen shots so it probably won’t make much sense on its own. You’ll have to come to the meeting!

Mashups – a free evening seminar from CILIP BBOD

I am giving a presentation on mashups at next Tuesday’s CILIP BBOD evening meeting.

Date: Tuesday 5th May 18.00 for 18.30 (postponed from February)

Presenter: Karen Blakeman

Venue: Great Expectations, 33 London Street, Reading, Berkshire RG1 4PS www.streetmap.co.uk/newmap.srf?x=471801&y=173139&z=0&ar=Y

Please advise Norman Briggs, BBOD Events Co-Ordinator Tel: 0118 987 1115 or nwbriggs@pcintell.co.uk
or Chrissy Allott, BBOD Chair Chrissy.Allott@berkshire.nhs.uk if you plan to attend

Seminar details

Mashups – tasty recipes for 2009

Mashups are not just for the remnants of your Christmas or Sunday dinner! A mashup is also a web application that combines data from more than one source into a single integrated tool, and you may be surprised at how commonplace they have become. Blogs, Yahoo Finance, Facebook, Geograph, and the latest UK police forces’ crime statistics all use mashups.

Karen Blakeman will look at examples from a variety of sectors and subject areas and show how easy it is to create your own. The issues of quality and ownership of data will also be addressed.

BBOD meetings are free and open to all with a professional interest in the topic.

Refreshments provided afterwards.

Twitterplan – UK local government mashup for planning applications

I discovered Twitterplan via a posting on Liz Azyan’s excellent blog – Twitterplan: The Newest Mashup in UK Local Government via her Twitterstream @liz_azyan .

Twitterplan is a new service that has been set up by Lichfield District Council with help from the City of Lincoln Council and Planning Alerts. It sends a Twitter direct message to you whenever a planning application is submitted in your area. Go to http://www.twitterplan.co.uk/ and follow the instructions on screen.

twitterplan2

The service covers 324 local authorities at present and there is a list of participants on the Twitterplan web site. My own council – Reading Borough Council – are included, which surprised me. Reading BC do not seem to be that keen to embrace Web 2.0 technologies and their web site can be a nightmare to navigate. They may be in the list, I thought, but will they actually deliver? A few hours after I had signed up my first two DMs arrived!

twitterplandm

I am impressed: click on the link and you are taken direct to the details on the authority’s web site. It beats having to carry out an advanced Google site search on the Reading BC web site and trawling through the local newspaper planning applications.

Keeping up with #uksnow disruption

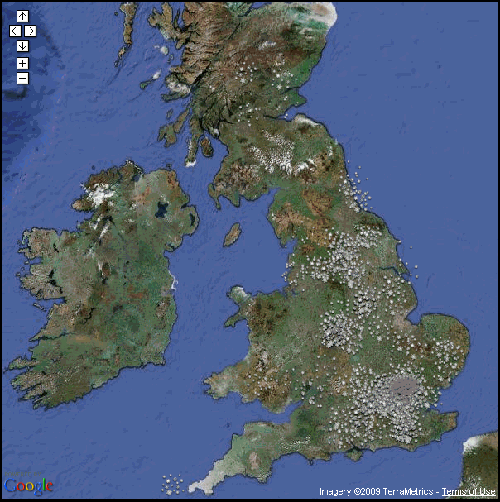
If  you are interested in monitoring how the snow is progressing across the UK Ben Marsh has compiled a Google-Twitter mashup to map tweets tagged with #uksnow. Twitter users have been using #uksnow for reports on the amount of snowfall and travel disruption that they encounter. If they also include the first part of their postcode and marks out of 10 for the amount of snowfall their tweet is automatically added to a Google map.  The site updates every minute.

#uksnow tweets 9.55 am 2nd February 2009